
To measure mobile billboard results, combine three sources: GPS route records that verify where and when the truck ran, impression estimates with a stated methodology, and tracked customer actions (campaign URLs, promo codes, calls or store visits) compared against a baseline period.
A mobile billboard can turn heads across a city. But when the truck finishes its route, the question is more specific: what did the campaign deliver?
The strongest answer brings together three kinds of evidence: where and when the ad ran, an estimate of the audience that had an opportunity to see it, and the actions people took during or after the campaign. Each answers a different question. None should be presented as proof of the others.
Start With the Goal
Decide what success means before you book the truck. A grand opening might prioritize store visits. A concert promotion might prioritize ticket sales. A new brand might want awareness among people in a particular district. A campaign supporting an event might need visibility at the right place and time.
Write down one primary goal and a few supporting measures. Then establish a baseline: normal website traffic, calls, sales, or foot traffic for comparable days. Without a baseline, a spike is interesting but difficult to interpret.
1. Verify Where and When the Truck Ran
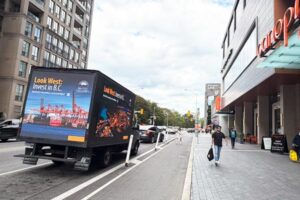
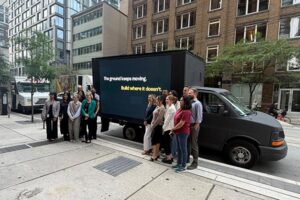
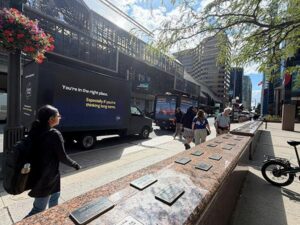
A GPS route log documents where the vehicle travelled and when. Pair it with the planned route, operating hours, creative schedule, and dated photographs or video from the campaign. Together, these provide evidence that the campaign ran in the agreed areas and that the display was operating.
For a Toronto launch, that could mean confirming the truck covered King and Queen West during evening peaks. In Mississauga, it could mean the Square One and Hurontario corridor on weekend afternoons.
Check the practical details: Did the route pass the intended shopping streets, entertainment districts, or event perimeter? Were the screens showing the right creative during the right hours? Did delays, road closures, or event restrictions change the plan? A truck merely passing through a city does not establish that it reached your intended audience.
Every Mobile LED Trucks campaign includes GPS route tracking and a campaign report. Ask our team for a sample report when you book.
2. Read Impression Estimates Correctly
An impression estimate describes potential advertising exposure under a stated measurement method. It is not a count of people who looked at the screen, remembered the message, or made a purchase. Traffic volume alone is also not an ad audience: viewing angle, screen visibility, operating time, and the number of people near the display matter.
Ask your provider:
- What data and method produced the estimate?
- Does it account for the actual route and hours, or is it a general citywide forecast?
- Is the figure a total of opportunities to see, an estimate of likely views, or a count of unique people?
- Can repeat exposures to the same person be included?
- Is the estimate for one screen, one truck, or the whole campaign?
Industry measurement guidance recommends clearly defined opportunity-to-see estimates and transparency about the method. If a report does not explain its assumptions, treat the number as a directional estimate rather than a precise headcount.
3. Track Actions You Can Observe
Give people a simple next step, then measure it. Depending on the campaign, that could be a memorable campaign URL, a dedicated landing page, a promotion code, a distinct phone number, event registrations, ticket sales, or store visits recorded by your own team.
Keep the ad readable at street level: one message, a short call to action, and a destination people can remember. A QR code may work when the truck is stationary and viewers have time to scan, but it should not be your only response path for an ad seen from a moving vehicle.
Set up tracking before launch. Mark the campaign dates and target locations in your analytics, and compare performance with a suitable baseline. Ask staff how visitors heard about you, while recognizing that self-reported answers will be incomplete.
4. Separate Correlation From Attribution
A rise in web traffic during a truck campaign is a useful signal. It is not automatically caused by the truck. Search ads, social posts, a news story, weather, a sale, or an event can change results at the same time.
For a more credible comparison, review similar days before and during the campaign, account for other promotions, and compare target areas with a suitable area where the truck did not run when possible. Larger campaigns can consider a structured brand-lift or location-based study with an appropriate measurement partner. Describe the result accurately: “sales increased during the campaign” is different from “the truck generated every additional sale.”
5. Calculate Cost in Context
Three basic calculations help put results in perspective:
- Estimated cost per thousand impressions (CPM), using CAD campaign spend: campaign spend ÷ estimated impressions × 1,000.
- Cost per tracked response: campaign spend ÷ responses measured through your selected tracking method.
- Return on ad spend (ROAS): revenue credibly attributed to the campaign ÷ campaign spend.
Suppose a campaign costs CAD $6,000 and produces an estimate of 300,000 opportunities to see. Its estimated CPM is $20. If a dedicated offer code produces 60 orders, the cost per code-tracked order is CAD $100. Neither figure establishes that only 60 people responded or that all 300,000 opportunities became actual views. Use the same definitions when comparing campaigns.
Not sure what a campaign costs? See how much mobile billboard advertising costs in Canada.
For the bigger picture, read are mobile billboards worth it and do advertising trucks drive sales.
What Should a Post-Campaign Report Include?
A practical report connects delivery with your original goal. Request the campaign dates and operating hours, route or location records, creative shown, dated proof photos, any audience estimates with their methodology, changes from the original plan, and the outcome measures supplied by your team.
Then ask a planning question: Which locations and times appeared most useful, and what would you change next time? The purpose of reporting is to improve the next route, schedule, and message—not simply to produce a large number.
Quick Answers
Can you measure a mobile billboard campaign?
Yes. You can verify delivery with route records and campaign evidence, estimate potential exposure using a stated method, and track selected customer actions. These measures answer different questions and work best together.
Are GPS data and impressions the same thing?
No. GPS records where and when a truck travelled. Impressions require a separate audience estimation method; GPS coordinates alone do not count viewers.
Can a mobile billboard prove it caused sales?
A sales lift during the campaign is a signal, not proof by itself. Dedicated response paths, baseline comparisons, and well-designed measurement studies can strengthen the case for contribution.
What should I measure for a local store opening?
Track whether the truck ran near the intended audience, then compare store visits, calls, directions requests, and opening-week sales with relevant baseline days. A distinct offer or landing page can add another measurable response path.
Make the Next Campaign Smarter
Set the goal before the first mile. Verify delivery. Read estimated exposure honestly. Track actions with a clear call to action. Then use what you learn to refine the next route and creative.
Planning a mobile billboard campaign in Canada? Tell Mobile LED Trucks your target market, dates, audience, and success goal. We can help shape the route and discuss the reporting available for your campaign.